


What explains delays in attrition?

I was quoted at the weekend in a Herald-Sun article about attrition from Victorian universities. The journalist wanted to know how much HELP debt students typically have on drop-out, but unfortunately this data is not regularly published (it should be of course).
But based on some old Grattan analysis, which had actual data to the mid-2010s, the fact that first year is the most common year for attrition, and the strong link between part-time study and attrition, I thought that the typical $$$ figure may not be too high.
That said, average or median HELP debt on dropping out may have increased at a faster rate than indexation in the early 2020s. This is due to students spending more time enrolled before dropping out.
Attrition after one year and four years
In the Grattan work I argued for a risk management approach to student selection - not being overly restrictive with offers but aiming for ASAP exits if things are not working out. The free 'try before you buy' period prior to the census date is a good feature of Australia's higher education system. But if high-risk students aren't identified before their first census date, it is cheaper for them in time and money if they don't go beyond first year.
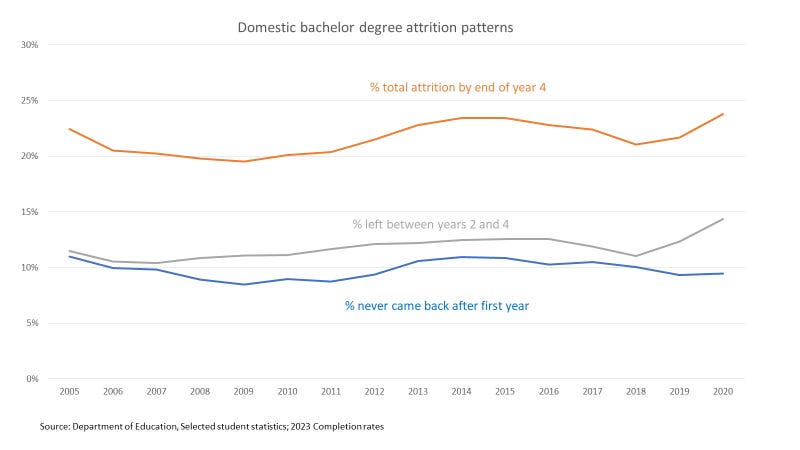
From that perspective, we want the gap between the proportion of students who never came back after first year and those who are gone at the 4-year mark to be as narrow as possible (the year points are dictated by what is reported in the completion rate statistics).
In the chart below, we can see a structural shift towards higher overall attrition since the demand driven system was introduced. But by the late 2010s the process of admitting and managing students was looking more efficient. The 2018 never-came-back after first year rate of 10% was the lowest since 2012. The 11% of 2018 commencers who dropped out between years 2 and 4 was the lowest since 2008.
But then for the 2019 and 2020 commencing cohorts we see something quite different and unusual - the never-came-back after first year rate improved again on 2018, but the 4-year attrition rate escalated. For the 2020 commencing cohort the 4-year attrition rate, 23.8%, was the highest recorded since the current tracking system began in 2005 (from then we follow students around the system, so transfers between institutions are not counted as attrition).
Attrition at the 6-year mark
An increase in late attrition is also showing in the 6-year attrition rates. In the chart below, at the 4-year mark the 2017 and 2018 commencing cohorts looked on track for high completion rates by the standards of recent years. But in years 5 or 6 since commencement - 2021 and 2022 for the 2017 cohort, 2022 and 2023 for the 2018 cohort - attrition spiked up, to rates resembling the demand-driven cohorts.

What is going on? Postponed attrition after first year
We can see in the chart below that attrition in the year immediately following first year dipped significantly for people who started studying in 2020, before returning to normal levels for the 2021 and 2022 commencing cohorts. Obviously 2020 was an unusual year - the year of the most widespread COVID lockdowns.

Decreasing commencing student attrition between 2020 and 2021 wasn't due to the unusually high quality of education offered in 2020. While the sector did well in delivering an unscheduled and rapid transition to online study, that was not what most students or their teachers had expected. Unsurprisingly, student satisfaction declined significantly.
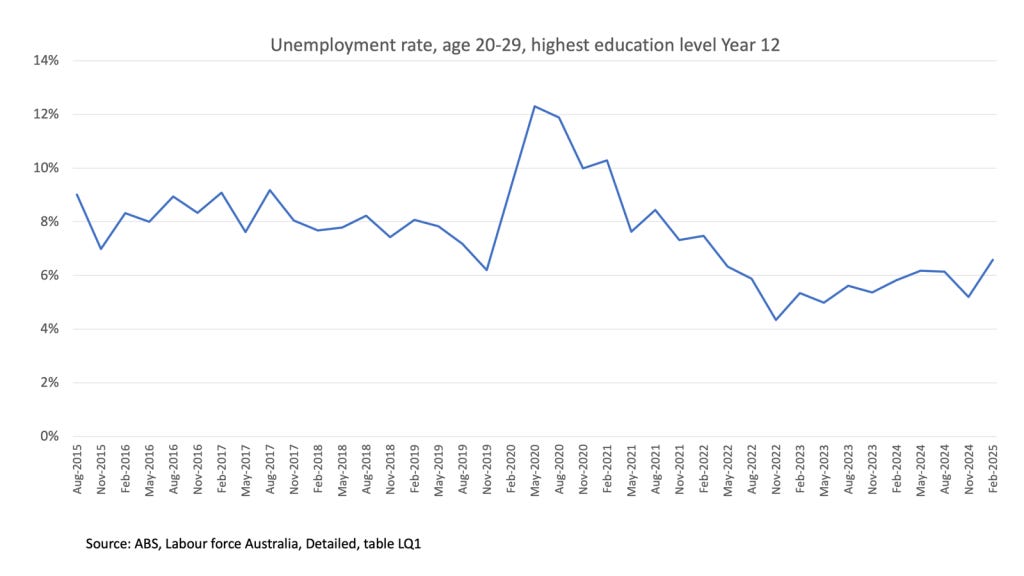
Dissatisfied students remained in higher education because other options, such as unemployment, were worse. Unemployment increased rapidly in the early COVID period, as shown in the chart below for the people with Year 12 qualifications who might have gone to university. While unemployment peaked in May 2020, my hypothesis is that economic uncertainty in late 2020 and early 2021 meant that some 2020 commencers re-enrolled despite being unenthusiastic about their studies. State-level differences support this theory. 2020-2021 commencing student attrition went down in NSW and Victoria, two states with high numbers of days in lockdown, while attrition went up in WA and Queensland, which had low numbers of days in lockdown.
As unemployment declined, however, some students pursued work instead of study.
What is going on? Later-term attrition
The attraction of the labour market versus study must, I think, also help explain why the attrition spike is evident even late in a student's studies. For two years from February 2022 the full-time employment rate for people aged 20-29 years with Year 12 as their highest qualifcation exceeded 40%, something it normally only achieves in the February quarter, as university students on summer breaks work full-time. The availability of full-time work changes the study/work trade-off, especially for people who enrol at university primarily to improve their job prospects.

What is going-on? Too much paid work while studying
In the Grattan attrition analysis, part-time study was the single biggest attrition risk factor. Part-time enrolment is a proxy for students having other commitments in their lives that reduce the time and energy they have left for their studies. The enrolment data, however, does not clearly show any major recent trend in undergraduate part-time study. For continuing students, part-time study increased in the 2010s and has been stable in recent years. For commencing students it is down in recent years, probably because school leavers are a larger proportion of the total.
But for full-time students we can see reasons why they may not have the energy to keep going. As the chart below shows, the proportion of full-time students in paid employment has increased in recent years.
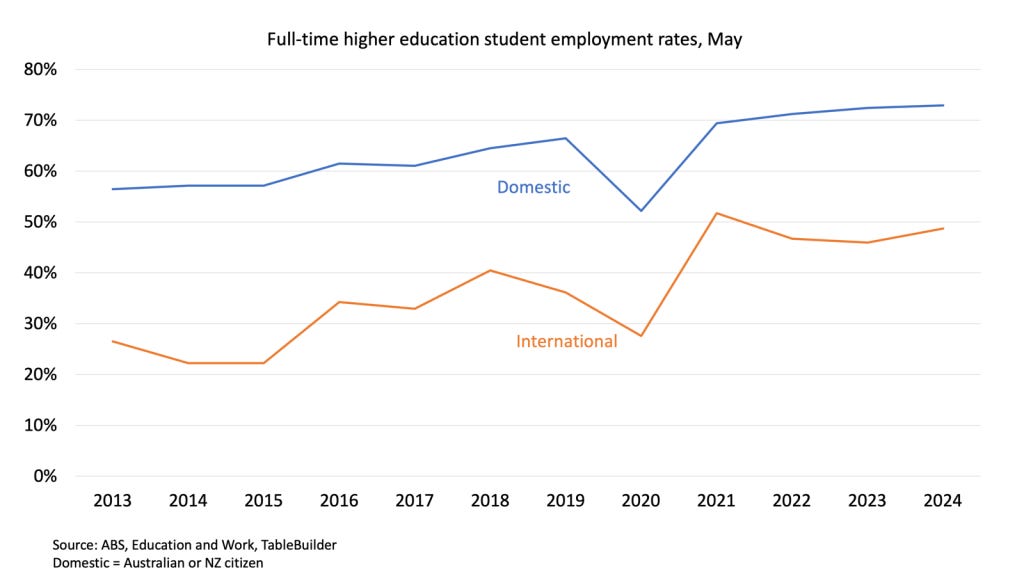
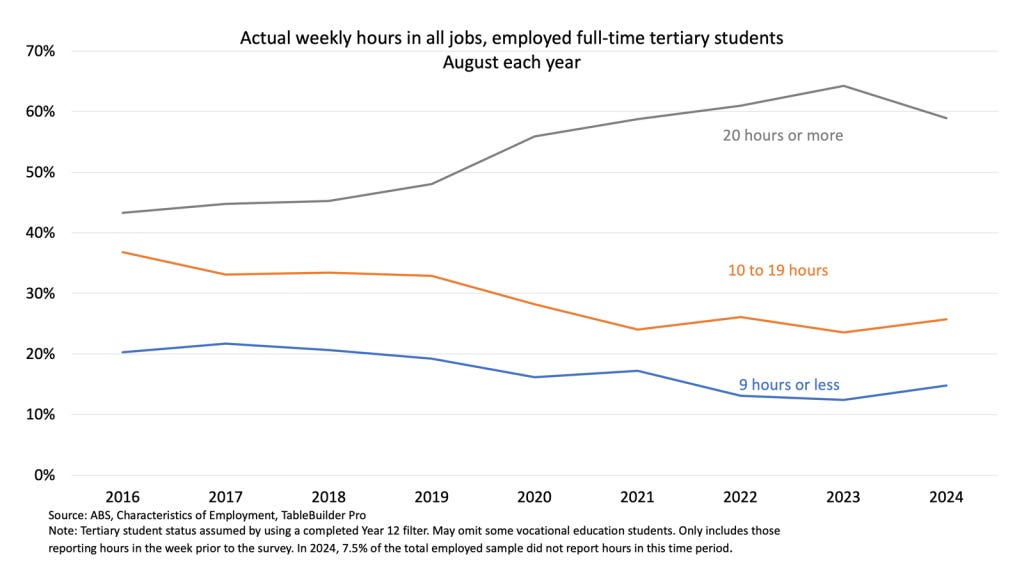
Perhaps more importantly for attrition, the proportion of employed full-time tertiary students (this data source does not separate vocational and higher ed students) working 20 or more hours a week has gone up. Cost of living factors have probably driven up both work rates and hours. As for part-time students, for full-time students working long hours the time and energy left for study is reduced.
Conclusion and future trends
The increase in late attrition is, I think, primarily due to the COVID-19 lockdowns and the strong post-COVID labour market. Dissatisfaction with the university experience is probably an exacerbating factor.
The attrition trend from here is speculative. Cost of living issues remain. Other factors may, however, be more positive at least for the aggregate figures. For the 2021 and 2022 commencing cohorts, the proportion of students not enrolled after first year was back to normal levels. Fewer students are delaying their near-inevitable departure prior to completion.
Mature-age students have relatively high attrition. In the period 2021 to 2023 their share of the commencing cohort declined. School leaver participation rates (that is, enrolments as a % of their own population, rather than total enrolments) were down in 2023. If the missing people in both cases would have been marginal students with high attrition rates that will make the overall figures look better.
20-something full-time employment rates have gone down to something more like normal 2010s levels, reducing a pull factor out of study.
A couple of policy changes may also affect attrition. The support for students policy introduced in 2024 could result in disengaged students being identified more quickly and making earlier exits from the system, at lower financial cost to them and taxpayers. But offering more support to struggling students could prolong enrolments with low chances of reaching completion. My intuition is that the net effects will be positive, but I could be wrong.
The Prac Payment for teaching, nursing and social work placements is due to start on 1 July 2025. We can hope that the Prac Payments help more students in these courses get their degrees.
Despite significant uncertainties, compared to the COVID period a lower-risk population and some other changes could increase completion. For the students at risk of not completing, exits after year 1 are back to normal and perhaps the support for students policy will be a net benefit.